
A metric tree does a different job depending on where you are. If you are in pre-seed or earlier, you may not be tracking much, but it tells you what to track and how each number affects your business. If you already track your numbers, it shows you the levers you can pull to move your financials.
Most founders track KPIs as a list: revenue, burn, churn, CAC, pipeline, headcount, each in its own row of the board deck with its own arrow. The list works until a number misses. Then it goes quiet. It can tell you ARR came in below plan. It cannot tell you why, because nothing on it says how the rows connect. A tree's hierarchy makes those relationships intuitive and obvious. Besides, charting the relationships is hard to do in a spreadsheet.
A metric tree does. It is the fastest way to turn "we missed" into "here is what happened, and here is what we are doing about it."
The short version:
- A metric tree breaks one outcome, such as ARR, into the metrics that produce it, all the way down to the KPIs and drivers your team can move.
- It explains any miss in minutes, puts a dollar value on every KPI, and turns a board goal into targets each owner can hit.
- A complete tree has three trunks, growth, profitability and survival, so one page shows what every decision does to all three.
What a metric tree is
A metric tree starts with one outcome and breaks it into the metrics that produce it. The outcome sits at the top, called the root, because the tree is drawn upside down like an org chart. Beneath it are the numbers that add up to it. Below those sit the operating numbers your team acts on: the KPIs that lead them, and the drivers that move the KPIs.
Read it top down and it explains a result. Read it bottom up and it shows what a change in the business will do to the number your board cares about. A KPI list gives you 20 numbers of equal weight. A tree gives you the one that matters most, and a path from it to everything else.
Metric, KPI, driver, lever
A metric tree reads top to bottom in four layers: the metric, the KPI that leads it, the driver of that KPI, and the levers the company pulls. Board decks use the four words interchangeably. In a tree they mean different things, and keeping them apart is what makes the tree useful.
- Metric. A financial number in the tree's formulas: ARR, MRR, new MRR, churned MRR, operating income, runway. Metrics add up exactly. Know the parts and you know the whole.
- KPI. An operating number that leads a metric. Trials and activation rate lead new MRR; qualified pipeline leads revenue. A KPI is not part of the metric's formula. It moves first, which is what makes it worth watching, and it gets an owner and a target.
- Driver. An operating number one level further upstream that moves the KPI. Onboarding completion drives activation rate; demos booked drive pipeline. A driver has to be something you can count every month, and it cannot be a piece of the KPI's own arithmetic. If deals won is opportunities times win rate, win rate is a component, not a driver.
- Lever. What the company actually does: roll back an onboarding step, raise prices on renewals, hire a second SDR. A lever is not a number, so it is not drawn in the tree. Levers are specific to each company. They come out of the conversation between the CFO and the founder, and they are agreed with the person who owns the KPI.
A quick test: if it is in a formula, it is a metric. If it moves before a metric and someone owns it, it is a KPI. If it moves the KPI and you can count it monthly, it is a driver. If you can decide on Monday to do it, it is a lever. "Hire SDRs" is always a lever, never a driver.
The chain is the point. Pull a lever, watch the driver, see the KPI follow, and the formulas carry the change up to the root. Only that last step is arithmetic. Every link below it is an expectation until your own numbers show it.
A worked example: SaaS
Take a subscription software company. The root is ARR, annual recurring revenue.
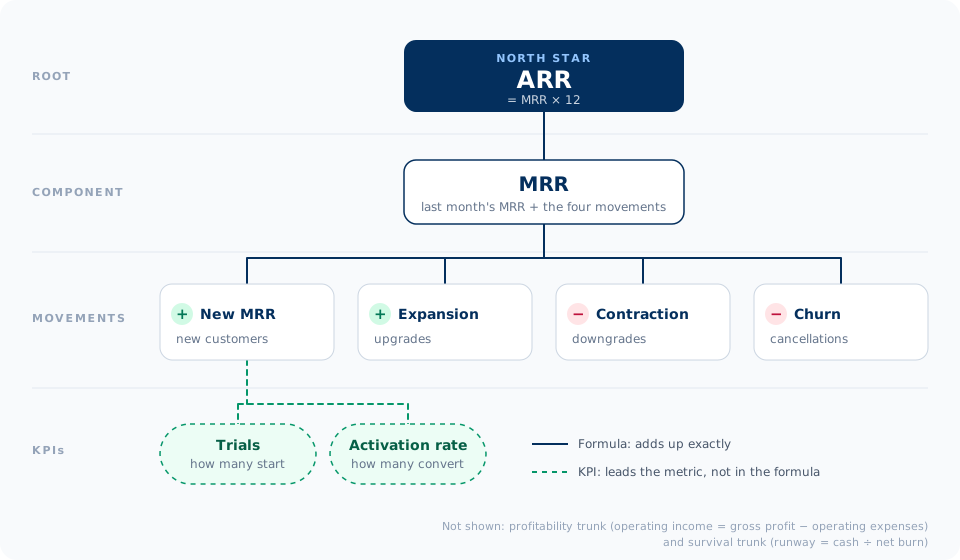
ARR is MRR times 12. MRR, monthly recurring revenue, rolls forward from four movements: new customers, expansion (existing customers paying more), contraction (paying less) and churn (leaving). Those four explain every change in recurring revenue. Beside new MRR sit the two KPIs that lead it: how many trials start, and the share that activate and pay.
The miss
The company starts the month at $92,000 of MRR and plans to finish at $100,000, or $1.2 million of ARR. The plan: 100 trials converting at 40% into customers paying about $250 a month, which is $10,000 of new MRR, plus $3,000 of expansion, less $1,000 of contraction and $4,000 of churn.
The month closes at $96,000. ARR is $48,000 short of plan. A KPI list stops there. The tree keeps going.
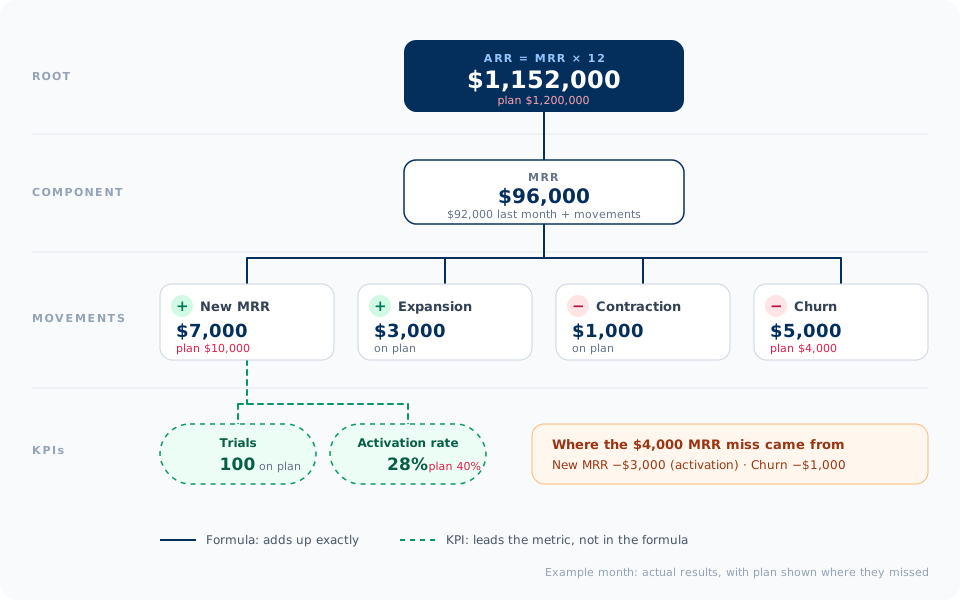
The movements. The $4,000 gap sits in two places: new MRR came in $3,000 short, and churn ran $1,000 high. Expansion and contraction held, so ignore them.
The KPIs. Trials were on plan at 100. Activation was not: 28% instead of 40%. Twelve fewer customers at about $250 each is roughly $3,000, the whole new-MRR shortfall.
Roughly, because that link is a KPI leading a metric, not a formula. Deal sizes could have moved too, and the tree draws the link as an influence for exactly that reason.
The driver. One level further down, onboarding completion, the share of trials that finish setup, fell from 70% to 52%. It dropped the month a new onboarding flow shipped.
The fix
The tree does not just explain the miss. It ranks the fixes, and the fixes are levers.
- Activation first. Each point of activation is worth about $250 of new MRR a month. Its driver broke with the new onboarding flow, so pull two levers: roll back the step that changed, and call the stalled trials before they expire.
- Don't buy more pipeline yet. Trials were on plan. More spend at the top would pour trials into a step that is leaking.
- Churn second. $1,000 over plan is small, but it repeats every month until it is fixed. Check whether the accounts that left share a cause.
- Leave expansion and contraction alone. They held.
The board update changes from "we missed ARR" to "activation fell after an onboarding change; we are reversing it, calling the stalled trials, and holding marketing spend until conversion recovers." That is a plan a board can hold you to, and it took four steps down the tree to find.
What a metric tree does for your business
A KPI list reports. A tree lets you reason. Here is what that buys you.
It explains any result in minutes
Every number has a path down to something someone did. Start at the root, compare it with plan, and walk down only the branch that moved until you reach a KPI someone owns, then ask which lever moved it. It works when a number beats plan too: find what is working and do more of it. The monthly review stops being a tour of 20 KPIs and becomes one explanation: what moved, why, and what you are doing about it.
It puts a price on every KPI
Because the metrics are arithmetic, every KPI beneath them has a working value. Here, a point of activation is worth about $250 of MRR a month, and a trial is worth $70 at today's 28% conversion. Price the KPIs and the levers sort themselves: fixing the onboarding step that leaks beats paying to fill the top of the funnel.
It turns a goal into targets that add up
Say the board wants $2 million of ARR in 12 months, up from $1.15 million today. Walk it down the tree:
- ARR to MRR. $2 million of ARR is about $167,000 of MRR: roughly $71,000 more, or $5,900 of net new MRR a month.
- Net new to new. With expansion at $3,000, contraction at $1,000 and churn back to its $4,000 plan, new MRR needs to reach about $7,900 a month.
- New MRR to customers. That is about 32 new customers a month at $250 each.
- Customers to KPIs. With 100 trials a month, activation has to get back to about 32%. Or, at today's 28%, the team needs about 113 trials.
Each owner gets a number they control, and the numbers add back up to the goal. When one slips, you can see which part of the goal is at risk, and whether another KPI can cover it.
It shows the trade-off before you make it
The company has $1.8 million in the bank and spends $210,000 a month. It is weighing two sales hires at $15,000 a month each, fully loaded. The tree shows both sides at once: net burn rises from $114,000 to $144,000 a month, and runway falls from 15.8 months to 12.5. To pay for themselves on burn, the hires need to add about $30,000 of MRR, roughly 120 customers. That is the bar, set before the money is spent.
It gives every number an owner
Marketing owns trials. Product owns activation. Customer success owns churn. Finance owns the formulas that connect them. Each owner reports on their KPI and the levers agreed for it, and the tree shows how their number moved the ones above it.
Three trunks: growth, profitability, and survival
One trunk is not enough, because one decision moves all three, and rarely in the same direction. Spending ahead of plan on sales can lift ARR while it deepens the loss and shortens runway. A complete tree has three trunks, each with its own root:
- Growth: what are you building? The root is the north star, ARR in the example. It matters at every stage. Before revenue, the north star is usually a usage number, such as weekly active teams.
- Profitability: does the business earn money? The root is operating income: gross profit minus operating expenses, the line EBITDA is built from. It matters from Series A onward and for any established business. Once a company is profitable, this becomes the main trunk.
- Survival: how long can you keep building? The root is runway: cash divided by net burn. It matters from pre-seed to Series B and whenever you burn cash. At seed, one slow month can move the next raise.
Run the example through all three. On plan, $100,000 of revenue against $210,000 of spending meant an operating loss of $110,000 and, keeping it simple, the same net burn: 16.4 months of runway. At $96,000, burn is $114,000 and runway is 15.8 months. One month's $4,000 miss cost about two and a half weeks of runway, and the cost compounds every month activation stays down.
Three kinds of connection
Not every line in a tree means the same thing, and the difference matters.
- Components add up or multiply out exactly. ARR is MRR times 12. Net burn is expenses minus revenue. Know the parts and you know the whole.
- Movements carry a number from last month to this month: new, expansion, contraction and churned MRR. They also add up exactly.
- Influences link a KPI to the metric it leads, or a driver to its KPI, without being in any formula. Pipeline leads new MRR, but no equation turns one into the other; the conversion rate in between moves on its own.
Confusing an influence with a formula is how board promises go wrong. "We doubled pipeline, so new MRR doubles next quarter" sounds like arithmetic. It is a forecast that assumes win rates and deal sizes hold, and they rarely do while you are scaling a sales team. Draw influences as influences and the assumption becomes visible before it becomes a miss.
The root depends on your business model
The profitability and survival trunks look the same for almost every company. The growth root does not.
- SaaS roots growth in ARR, because recurring revenue compounds and retention shows up in it directly.
- E-commerce roots it in gross profit, net revenue minus cost of goods sold (COGS), because revenue without margin does not pay for the next order.
- Marketplaces root it in net revenue, the slice of transaction value you keep, with active sellers, match rate and take rate beneath it.
- AI software keeps the SaaS root, ARR, but reaches deeper into cost: inference cost sits inside COGS, with KPIs like GPU utilization and the share of requests routed to smaller models.
- Pre-revenue biotech has no profitability trunk yet, and roots growth and survival both in runway. Until there is revenue, progress and survival are measured by the same number: months of cash to reach the next milestone.
Pick the wrong root and the tree will cheer for the wrong thing. An e-commerce company rooted in revenue will celebrate growth that loses money on every order.
How to build one
- Pick a root for each trunk. Your north star for growth, operating income for profitability, runway for survival.
- Write each root's formula one level down, then keep going until every branch ends in a number you already record.
- Turn balances into movements. Anything that carries over month to month, like MRR or cash, gets the flows that change it.
- Hang KPIs beside the metrics they lead, and drivers under the KPIs they move. Label each link an assumption until your own data shows it.
- Give each KPI an owner and a target, agree the levers with that owner, then review the tree, not a list, every month.
How to diagnose a miss with a metric tree
A metric tree does more than explain what moved. Used against a plan, it tells you what went wrong, how sure you can be, and what is still unexplained. Work through it in this order:
- Name the reference. A number is not wrong on its own, only against something: the budget, a target, last month. Say which one, because the same figure can be over budget and ahead of last year.
- Measure the gap both ways. Look at the lines that came in over and the lines that came in under, not just the net. A $40k overspend in sales and marketing can hide behind a $30k underspend in R&D and look like a $10k problem.
- Walk the gap down the tree. Follow the branches that account for it until you reach the lines that caused it. The pieces must add up to the gap, and whatever they do not explain gets its own line instead of disappearing.
- Check the data before the business. A failed reconciliation, a late sync or a month restated after close can make a healthy business look broken. Rule those out first.
- Separate timing and one-offs. A conference paid in March and budgeted in April, or a one-time legal bill, is not a trend. Mark it, and look at what is left.
- Only then explain the cause. Tie what remains to something that happened: a hire, a lost customer, a price change. Keep correlations labelled as correlations, and leave anything you cannot explain as unexplained rather than guessing.
Done this way, a variance review stops being an argument about the numbers and becomes a short list of real problems, each with its size and a named owner. That list is where decisions start: weigh the options for each real problem against your own limits, such as a runway floor, decide, and check at the next close whether the decision did what you expected.
How ClariFi pushes the metric tree further
ClariFi, the platform behind our service, takes the metric tree further. Our goal was to make it intuitive and easy to use, so you can see what moved, what went wrong, why, and what to do about it without building anything in a spreadsheet. It does that in twelve ways:
- Three trunks, not two. Many startup trees stop at growth and survival. ClariFi adds profitability, rooted at operating income, so the same tree keeps working once a company is past burning cash.
- Built for your industry, with definitions you can check. Every company starts from a default tree for its industry rather than one SaaS tree stretched to fit: AI software tracks inference cost, a nonprofit runs on operating surplus and months of cash. Every metric has a written definition and formula, follows QuickBooks where bookkeeping products differ, and is mapped to the open SOMA library.
- Every change, attributed exactly. Each trunk page marks the path of the largest change from the root down, and a bridge splits the root's change into what each part contributed, to the dollar. When recorded movements don't explain all of a change, the gap gets its own bar instead of being spread across the rest.
- What went wrong, diagnosed against a plan. Beside what moved, ClariFi shows what went wrong against a named reference: your budget, a goal, a target or last period. It measures the gap both ways, gross and net, for the month and the year to date, and walks it down the tree so the pieces add up exactly, with anything unexplained on its own line. Data problems such as a failed tie-out or a restated month come first, so a bad reconciliation is never mistaken for a bad month, and every gap opens to show how it was worked out.
- Runway explained, not just reported. A cash bridge walks from opening to closing cash through receipts, payroll, vendors and financing, which sits on its own line. When the month you would run out of cash moves, ClariFi splits the change into cash level, burn rate and time simply passing.
- KPIs from your own data, labelled for what they are. Operating numbers like qualified pipeline or utilization sit beside the metric they lead, so a slip can show up there before it reaches the numbers above. Each says whether its link is an assumption or a relationship measured in your own history. A measured link is a correlation, and ClariFi labels it as one, so a forecast can't pass for arithmetic.
- Drivers beneath each KPI. Open a KPI and its drivers sit underneath, each with its trend and the same assumed-or-measured label. Every industry starts with a default set, and your CFO team adds the ones specific to your business. A driver can move with its KPI or against it, so a driver whose rise comes before its KPI falls is recorded that way. When a driver can't be tested yet because its KPI isn't recorded, ClariFi says so and names what to record.
- Levers agreed, written down. Beside each KPI's owner sits a note of the levers you and your CFO agreed for it, so the next review starts from what was promised. The note stays inside ClariFi: it is not printed in the board pack and is never shared with AI.
- A tree you can question, not just read. Change any input, such as churned MRR or an expense line, and every metric built from it recalculates with the tree's own formulas, through margins, burn and runway. Or work backward: name a target, like $2 million of ARR, pick the input to change, and ClariFi solves for what it would take. Only formula inputs move the numbers, so a what-if stays arithmetic, not a guess about KPIs or drivers. A figure the what-if doesn't rework is marked as not worked out rather than shown unchanged, and a scenario that ends the burn or runs out of cash says so in words. Set a target on any metric and its card shows whether you are ahead of or behind pace, and the Goals page shows the current figure each target is graded on.
- One explanation, everywhere. The same attribution feeds your monthly CFO memo, your board pack and, on Growth, your own AI assistant, so every report explains a change the same way.
- Options evaluated, and you decide. For a problem that is real, ClariFi lays out the options against your own limits, with doing nothing as the baseline: what each one closes, what it costs, how reversible it is and what it does not model. Options are never ranked or recommended. Your decision-maker makes the call, and ClariFi records it.
- Checks what happened. The forecast each decision was made on is kept, and at every close ClariFi compares it with what actually happened, so you learn which assumptions held and which did not.
Who gets it. ClariFi powers every StartupCFO plan, with your bookkeeper and CPA running your finances on it. Direct access, so you can open the trunk pages and run what-ifs yourself, is included in the Growth plan and available on Foundation for an added fee. Setting your own targets is part of Growth; on other plans our team sets them with you. Diagnosis against last period works on every plan; against your budget and goals, and evaluated options and decisions, it is part of Growth. See pricing.
See the tree for your industry
We have mapped every core startup metric into trees by industry, with definitions, formulas and stage benchmarks for each node. Start with SaaS, AI software, e-commerce, marketplaces or biotech, or browse the full Metric Tree for all 15 industries.
